Post Contents
Lead generation ROI measures how much revenue comes from your lead generation efforts compared with what you spent to produce those leads.The formula is simple. The hard part is trusting the inputs.B2B leads come from content syndication, events, webinars, paid media, partners, ABM programs, social, and forms. Each source has its own formats, rules, metadata, and reporting gaps. By the time those leads reach your marketing automation platform or CRM, the data may already be incomplete, duplicated, misformatted, non-compliant, late, or disconnected from the campaign that created it.That is why lead generation ROI is a pipeline integrity problem before it is a reporting problem. Bad inputs produce confident, wrong outputs. Clean, governed lead data helps marketing and revenue teams see which programs create pipeline, which waste budget, and where to act next.Integrate fits upstream of your MAP and CRM. It helps validate, deduplicate, enrich, standardize, govern, and route leads before they land in downstream systems. It complements attribution platforms, BI tools, ABM platforms, MAPs, and CRMs. It does not replace them.
Key Takeaways
- Lead generation ROI measures revenue impact, not lead volume.
- Cost per lead is useful, but it can hide poor lead quality.
- ROI measurement depends on clean data, consistent source tracking, fast lead movement, and reliable conversion feedback.
- Attribution tools, CRM reports, and BI dashboards are only as useful as the data feeding them.
- The biggest ROI leaks often happen before sales ever sees the lead: bad formatting, slow manual processing, poor TAM fit, late enrichment, duplicates, and missing closed-loop feedback.
- Integrate helps upstream by governing leads before they reach the MAP or CRM, then connecting source and disposition data through Conversion Insights and Closed Loop.
What is lead generation ROI?
Lead generation ROI measures how much revenue comes from your lead generation efforts compared with what you spent to create those leads.
A basic way to express it is:
Net revenue from leads / lead generation cost = ROI multiplier
For example:
$50,000 in net revenue / $10,000 in lead generation cost = 5x ROI
You can also calculate ROI as a percentage:
(Revenue – cost) / cost x 100 = ROI percentage
For example:
($60,000 – $10,000) / $10,000 x 100 = 500% ROI
The formula is not the issue. The issue is whether your revenue, cost, source, campaign, lead status, and conversion data are accurate enough to make the result useful.
In our work with B2B demand teams, the ROI problem usually shows up as a reporting problem first. It is usually an intake problem underneath.
How do you calculate lead generation ROI?
A practical lead generation ROI process has five steps.
1. Define what return means
Start by deciding what “return” means for the program.
For some campaigns, return means closed-won revenue. For others, especially earlier in the funnel, the near-term return may be qualified pipeline, sales-qualified leads, sales-accepted opportunities, meetings booked, or cost per qualified opportunity.
Do not mix goals across programs without saying so. A webinar, a content syndication campaign, and a late-stage account acceleration program may all contribute to revenue, but they should not always be judged on the same time horizon.
2. Capture the full cost
Lead generation cost can include:
- Media spend
- Content syndication spend
- Event or webinar costs
- Agency fees
- Creative and production costs
- Technology costs
- Internal labor and operations support
You do not need a perfect cost model to start. You do need a consistent one. If one channel includes labor and another does not, the comparison will be misleading.
3. Connect every lead to the right source and campaign
Every lead should carry enough source detail to support ROI analysis later.
At minimum, that usually means:
- Channel
- Publisher, partner, vendor, or platform
- Campaign
- Offer or asset
- Source
- Date captured
- Lead status or disposition
- A stable lead identifier for downstream feedback
This is where many ROI models fail. If the source data is inconsistent at intake, the downstream report will require manual cleanup or guesswork.
4. Track downstream progression
Lead generation ROI depends on knowing what happened after capture.
Useful progression stages include:
- Accepted lead
- Rejected lead
- Marketing-qualified lead
- Sales-qualified lead
- Sales-accepted opportunity
- Pipeline
- Closed-won revenue
- Closed-lost outcome
- Returnable or invalid lead
The more consistently you capture these stages, the easier it becomes to compare programs based on business outcomes rather than lead volume.
5. Match the measurement window to the buying cycle
If your average sales cycle is 90 days, a 30-day ROI read will be incomplete.
Use leading indicators early, then update the analysis as pipeline matures.
| Time window | What to measure | Why it matters |
|---|---|---|
| First 7 to 14 days | Accepted lead rate, rejection reasons, speed-to-lead | Shows whether leads were usable and acted on quickly |
| First 30 to 60 days | MQL and SQL conversion | Shows whether the source produced qualified demand |
| First 90 to 180 days | Opportunity creation and pipeline | Shows whether demand moved into revenue process |
| Later stages | Closed-won revenue, CAC, payback | Shows final business impact |
Long buying cycles are normal in B2B. Demand Gen Report’s coverage of the 2024 6sense Buyer Experience Report notes that B2B buyers are often far into the purchase process before first contact, with many having a preferred vendor before they engage sales. That makes early source quality and full-funnel tracking more important, not less important. Source: Demand Gen Report
Lead generation ROI vs. cost per lead
Cost per lead tells you how much you paid to generate a lead.
Lead generation ROI tells you whether those leads helped create revenue.
| Metric | What it measures | Where it helps | Where it fails |
|---|---|---|---|
| Cost per lead | Spend divided by lead volume | Budget pacing and vendor comparison | Can reward cheap, low-quality volume |
| Cost per qualified lead | Spend divided by leads that meet agreed criteria | Source quality comparison | Depends on clean qualification rules |
| Cost per qualified opportunity | Spend divided by opportunities created | Pipeline efficiency | Needs accurate opportunity matching |
| Lead generation ROI | Revenue or pipeline return compared with cost | Business impact | Breaks when source and conversion data are unreliable |
CPL is an input metric. ROI is an outcome metric. You need both, but they answer different questions.
A low CPL can look efficient while still producing weak pipeline. If a campaign produces a large number of invalid, duplicated, off-ICP, or unmarketable leads, the CPL may look good, but the ROI will not.
Why is lead generation ROI hard to measure?
Most B2B teams are not short on dashboards. They are short on trusted, comparable data.
Fragmented lead sources
Enterprise demand programs rarely depend on one channel. Leads may come from content syndication, field events, webinars, paid social, paid search, partners, review sites, and list uploads.
Each channel may define a “lead” differently. Each vendor may send data in a different format. Some sources include rich campaign metadata. Others require manual cleanup before a lead can be used.
If source and campaign data are not standardized at intake, ROI analysis breaks later. You may know that revenue closed, but you may not trust which program should get credit.
Poor lead data quality
Lead quality and lead data quality are different.
- Lead quality is whether the person or account is a good fit.
- Lead data quality is whether the record itself is accurate, complete, standardized, compliant, and usable.
A lead may look valuable but still create problems if the email is invalid, the phone number is malformed, the company name is inconsistent, consent is missing, or the same person already exists under another record.
Those problems affect more than operations. They distort routing, scoring, attribution, conversion rates, and ROI.
Incomplete attribution
B2B buying is usually multi-touch. A prospect may attend a webinar, download a syndicated asset, visit the website, engage with a sales rep, and then become an opportunity weeks or months later.
Single-touch attribution is easier to explain, but it often hides the role of earlier touches. Multi-touch attribution gives a fuller view, but it only works if touchpoint data is clean and consistently tied to the right lead, contact, account, campaign, and opportunity.
Integrate does not replace a full attribution platform or multi-touch attribution model. It helps with the upstream data foundation those systems depend on.
Slow lead movement
Speed-to-lead is not only a sales issue. It is often a data operations issue.
If leads sit in spreadsheets, wait for manual formatting, fail field validation, or require enrichment before routing, the follow-up window shrinks before sales ever receives the record.
A widely cited Harvard Business Review lead response study found that companies responding within an hour were much more likely to qualify leads than companies that waited longer. Qualified summarizes the study and its 42-hour average B2B response-time finding here. Source: Qualified
That does not mean every lead requires the same follow-up motion. It does mean manual intake and delayed routing should be treated as ROI leakage.
Where does lead generation ROI leak before sales sees the lead?
The biggest ROI leaks often happen before the lead reaches the CRM.
Leak 1: Improperly formatted leads break routing and scoring
A lead can be real and still fail operationally.
Common examples include:
- Country values that do not match routing rules
- Phone numbers in inconsistent formats
- Job titles that do not normalize into persona segments
- Company names that do not match account records
- Missing required fields
- Consent values that cannot be interpreted by downstream systems
When this happens, leads get misrouted, stuck in queues, scored incorrectly, or sent back for manual repair.
Lead Factory is built for this kind of upstream cleanup. It helps turn raw inbound lead data into complete, standardized, enriched records before the data touches the MAP or CRM.
The ROI point is simple: if a lead cannot be routed, scored, segmented, or contacted correctly, the spend that created it is already leaking.
Leak 2: Manual processing kills speed-to-lead
Manual lead handling creates hidden drag.
Someone downloads a file. Someone cleans a spreadsheet. Someone maps fields. Someone checks errors one at a time. Someone uploads the data later.
By then, the prospect’s attention may have moved on.
Integrate’s Faster Action positioning is directly tied to this problem: automate intake, cleanup, validation, and delivery so teams can act in minutes instead of days.
In our work with B2B marketing teams, this is one of the most common places ROI gets lost. The campaign may have generated demand, but the operating model was too slow to capture the value.
Leak 3: Top-of-funnel programs are not tied to TAM or ICP
Top-of-funnel volume is easy to buy. Relevant top-of-funnel demand is harder.
If programs are not governed against target account lists, ICP criteria, suppression lists, persona rules, and regional requirements, teams can spend heavily on leads that were never likely to convert.
This is where ABM and intent platforms matter. Tools like 6sense and Demandbase help teams define and prioritize target accounts. Integrate’s role is different: it helps operationalize those rules at intake so lead sources are checked against the market you actually want to reach.
That matters because TAM alignment should not happen only in a dashboard after the campaign is over. It should happen programmatically before bad-fit demand enters the funnel.
Leak 4: Enrichment happens too late to improve mid-funnel action
Many teams enrich leads only after they are already in the CRM.
That is late.
If enrichment happens after routing, scoring, nurture, segmentation, and sales alerts, then the mid-funnel actions were already based on incomplete data.
Earlier enrichment can improve:
- Persona segmentation
- Account matching
- Lead scoring
- Nurture routing
- Sales context
- Regional handling
- Target-account qualification
Integrate’s release materials and product pages describe enrichment, deduplication, and formatting improvements such as ZoomInfo enrichment and phone format enrichment. The business point is not enrichment for its own sake. It is better action earlier in the journey.
Leak 5: Duplicate engagement inflates volume and distorts ROI
Duplicate leads make programs look bigger than they are.
A person may engage with the same asset multiple times. The same contact may arrive from multiple partners. The same account may appear under inconsistent company names.
If duplicates are not handled consistently, teams can overcount demand, misread conversion rates, trigger redundant nurture, create bad sales experiences, and pay for leads that should not count as incremental.
Deduplication protects ROI measurement by separating real new demand from repeated or invalid records.
Leak 6: Missing closed-loop feedback hides what converted
If downstream conversion data never gets back to the source, optimization stays shallow.
The team may know how many leads a publisher delivered. It may not know which publisher produced SQLs, opportunities, closed-won deals, or returnable leads.
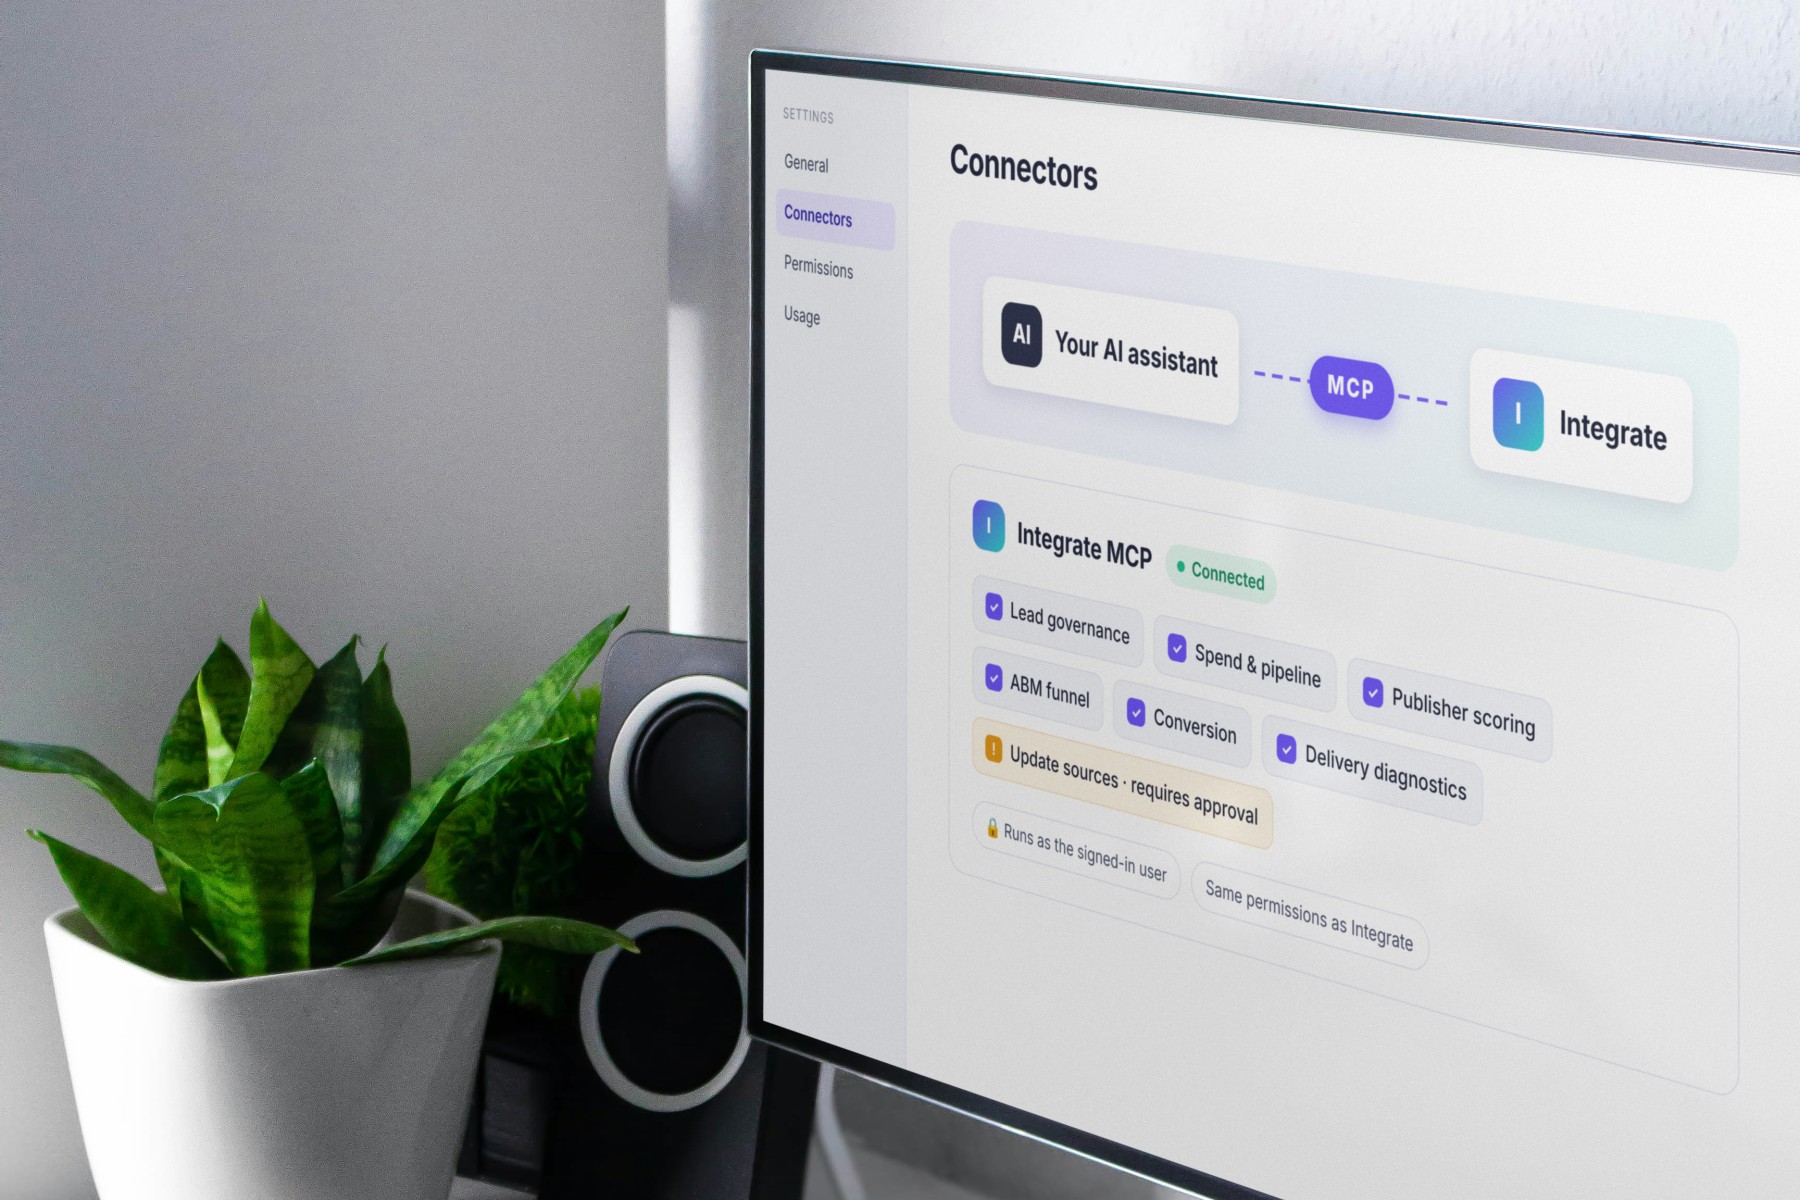
Closed Loop Attribution sends lead disposition updates from the MAP or CRM back into Integrate so teams can see which publishers, channels, campaigns, and sources convert. Integrate’s Pipeline That Converts page also frames Conversion Insights around connecting spend to pipeline and revenue outcomes.
This is not a replacement for full multi-touch attribution. It is a governed feedback loop for understanding which lead sources created business outcomes.
Which metrics matter most for lead generation ROI?
Start with a small set of metrics that connect spend to pipeline quality.
Cost per qualified opportunity
Cost per lead is easy to calculate. Cost per qualified opportunity is more useful.
It shows how much you spent to create a lead that became a real sales opportunity. This helps expose channels that look cheap at the lead stage but expensive once quality is considered.
Lead-to-opportunity conversion rate
Lead-to-opportunity conversion rate shows how many leads become opportunities.
If one channel generates many leads but few opportunities, the issue may be targeting, offer quality, lead validation, routing, follow-up speed, or sales fit.
Accepted lead rate
Accepted lead rate shows how many leads pass your intake rules and are usable by downstream systems.
Low accepted lead rates can point to bad source quality, weak vendor controls, missing fields, invalid contact data, or compliance problems.
Rejection and return reasons
Rejection reasons are not just operational details. They are budget signals.
If one publisher or campaign produces a high rate of duplicates, invalid emails, wrong-persona leads, or non-contactable records, that should affect renewal and spend decisions.
Conversion rate by channel, publisher, and campaign
A single blended conversion rate hides too much.
Break conversion down by channel, publisher, campaign, source, and offer when possible. That is how teams find the programs worth scaling and the ones that need to be fixed, renegotiated, or cut.
Pipeline and revenue by source
The final question is not “Which campaign produced the most leads?”
It is “Which campaign produced pipeline and revenue at an efficient cost?”
Pipeline and revenue by source help answer that question, but only if the source data and downstream disposition data are tied together cleanly.
What benchmarks should you use for lead generation ROI?
There is no universal B2B lead generation ROI benchmark that applies cleanly across every company.
Benchmarks vary by:
- Average contract value
- Sales cycle length
- Channel mix
- Lead source
- Market maturity
- Target account narrowness
- Qualification criteria
- Brand awareness
- Sales capacity
Use external benchmarks as a directional check, not as a performance target by themselves.
The better benchmark is internal and segmented:
- ROI by channel
- ROI by publisher
- ROI by campaign
- Cost per qualified opportunity
- MQL-to-SQL conversion by source
- Opportunity rate by source
- Closed-won revenue by source
- Rejection rate by source
- Speed-to-lead by source
Why does clean data come before ROI analysis?
Many teams try to solve ROI measurement in the dashboard layer.
That helps only if the underlying data is already reliable.
If leads enter the MAP or CRM with inconsistent field values, missing consent, duplicate records, incomplete campaign metadata, or unclear source attribution, the dashboard will still produce a number. The problem is that the number may be wrong.
This is the data-quality wedge: ROI measurement is downstream of intake quality.
Before you trust a lead generation ROI report, ask:
- Were the leads validated before they entered the MAP or CRM?
- Were duplicates removed or flagged consistently?
- Were fields standardized across sources?
- Was compliance enforced at intake?
- Was source, campaign, publisher, and offer captured cleanly?
- Were leads checked against TAM, ICP, and target account rules?
- Was enrichment applied early enough to improve routing and nurture?
- Was downstream disposition tied back to the original lead without exposing unnecessary personal data?
- Were rejected or returnable leads tracked separately from usable leads?
If the answer is no, the ROI report may be measuring the mess, not the marketing.
How does closed-loop visibility improve ROI measurement?
Closed-loop reporting connects what happened downstream back to the original lead source.
That matters because the marketer who paid for the lead often loses visibility once the lead posts to the MAP or CRM. Without a feedback loop, optimization falls back to volume, CPL, last-touch reporting, or vendor-reported performance.
A better model sends disposition updates back from downstream systems to the platform that governed the lead at intake. Those updates can show whether a lead became an MQL, SQL, opportunity, pipeline, closed-won deal, or returnable lead.
Integrate’s Conversion Insights uses returned non-PII disposition data to show performance by channel, publisher, campaign, source, and disposition level. Closed Loop can return bad or returnable leads to media partners for replacement or refund when the returned disposition supports that workflow.
This does not make Integrate a full multi-touch attribution platform. It gives demand generation and marketing operations teams cleaner, more usable visibility into how governed leads perform after they leave the intake layer.
Where does Integrate fit?
Integrate sits between demand generation channels and the MAP or CRM.
Its role is to make sure lead data is usable before it reaches downstream systems. That includes validation, deduplication, enrichment, standardization, compliance enforcement, and delivery into the systems your team already uses.
Integrate’s public positioning describes this as the pipeline integrity layer: clean data, faster action, and pipeline that converts. Source: Integrate
Here is the practical mapping:
| ROI leak | Business impact | Integrate role |
|---|---|---|
| Misformatted leads | Bad routing, failed scoring, manual repair | Standardize and validate before MAP/CRM delivery |
| Manual processing | Slow follow-up, stale intent, lower conversion potential | Automate intake, cleanup, and delivery |
| Poor TAM or ICP fit | Spend goes to accounts that should not be in the program | Apply target account and governance rules upstream |
| Late enrichment | Weak segmentation, scoring, nurture, and sales context | Enrich before downstream action |
| Duplicate leads | Inflated volume and distorted ROI | Deduplicate at intake and by asset where supported |
| Missing disposition feedback | Budget decisions rely on volume instead of conversion | Use Conversion Insights and Closed Loop to tie outcomes back to source |
This is the boundary: Integrate complements your MAP, CRM, ABM, BI, and attribution platforms. It does not replace them. It makes the data entering them cleaner, faster, and easier to trust.
How does better ROI measurement change decisions?
Better ROI measurement is not just a reporting win. It changes how teams allocate money and time.
With cleaner intake data and downstream feedback, teams can:
- Shift spend away from channels that create volume but not pipeline.
- Renegotiate or replace vendors that produce high rejection or low conversion rates.
- Scale publishers and campaigns that create qualified opportunities.
- Catch data-quality problems before they distort reporting.
- Reduce manual reporting and lead cleanup work.
- Give sales cleaner, faster, more useful leads.
- Defend budget with evidence instead of anecdotes.
The point is not to build a prettier dashboard. The point is to make better decisions sooner.
Common lead generation ROI mistakes
Treating all leads as equal
A lead that cannot be contacted, routed, scored, or tied to a campaign should not carry the same weight as a clean, compliant, ICP-fit lead.
Optimizing for CPL alone
Low CPL can be useful, but it is not proof of ROI. If cheap leads do not convert, they are not efficient.
Measuring too early
Short measurement windows can punish channels that create real pipeline over a longer buying cycle.
Ignoring rejected leads
Rejected leads are part of the ROI story. They show where spend is being wasted and where source quality needs attention.
Fixing data only after it reaches the CRM
Reactive cleanup is slower and less reliable than governing data at intake. By the time bad data reaches downstream systems, it may already have affected routing, reporting, scoring, and sales follow-up.
Letting enrichment happen after the important actions
If enrichment happens after routing, scoring, and nurture decisions, it cannot improve those actions. Enrichment is most useful when it improves the next decision, not when it decorates a record after the fact.
Closing the loop on lead generation ROI
Lead generation ROI comes down to a simple question: did the money you spent create pipeline and revenue worth more than the cost?
Answering that question takes more than a formula. It takes clean source data, governed intake, consistent attribution fields, fast lead movement, downstream conversion feedback, and a measurement window that matches your sales cycle.
Dashboards and attribution tools matter, but they cannot fix broken inputs by themselves.
If the data entering your MAP or CRM is dirty, duplicated, incomplete, late, or disconnected from its source, your ROI model will inherit those problems. If the data is clean, standardized, compliant, enriched early, and tied to downstream outcomes, the conversation changes.
You stop asking whether marketing created enough leads.
You start asking which programs created pipeline that converts.
Frequently Asked Questions
What is a good lead generation ROI benchmark for B2B?
A good lead generation ROI benchmark depends on your sales cycle, ACV, channel mix, target market, and attribution model. Use external benchmarks as directional context, but build your operating benchmark from your own cost per qualified opportunity, opportunity rate, pipeline created, and closed-won revenue by source.
What is the difference between CPL and lead generation ROI?
CPL measures how much you spent to generate a lead. Lead generation ROI measures whether those leads created enough pipeline or revenue to justify the spend. CPL is an input metric. ROI is an outcome metric.
Which attribution model should you use for lead generation ROI?
Use the simplest attribution model that supports the decision you need to make. First-touch can help evaluate top-of-funnel source creation. Last-touch can show what converted immediately before sales engagement. Multi-touch attribution is better for complex buying journeys, but it depends on clean and consistent touchpoint data.
Integrate does not replace multi-touch attribution tools. It helps improve the upstream lead and source data those tools rely on.
How should you measure ROI with a long sales cycle?
Use staged measurement. Start with accepted lead rate, rejection reasons, source quality, and speed-to-lead. Then track MQL, SQL, opportunity creation, pipeline, and closed-won revenue as the buying cycle matures. Do not judge a 180-day sales cycle on a 30-day revenue window.
How can you improve lead generation ROI after measuring it?
Start where value leaks. Fix bad formatting, reduce manual processing, enforce TAM and ICP rules at intake, enrich leads before mid-funnel decisions, deduplicate repeated engagement, and connect disposition feedback back to source. Then reallocate spend toward the sources that produce qualified pipeline, not just lead volume.