Campaign Insights
In this article, the last in our 90 days to precision demand marketing series, we’ll cover the three critical ways you can defend your marketing budget through response-to-revenue reporting.

First, let’s recap the first four steps in my 90 days to precision demand marketing plan.
Step 1: Marketable Connected Data – We got our data right by identifying the right accounts, buying groups and personas. Then we updated our database to make sure that 85% of the account and contact data was accurate, valid, and compliant. Integrate has always played a key role for me at this stage.
Step 2: Demand Channels – We destroyed internal silos and aligned marketing, SDRs, sales and the finance teams. We implemented SLAs and rules of engagement, and agreed on demand funnel language, metrics, and goals.
Step 3: Data Intelligence – We focused our teams by folding in intent and engagement metrics across our accounts and people. Then we defined responsibilities throughout marketing, SDRs and sales.
Step 4: MarTech Integrations – We connected and aligned our technologies to a consistent dataset that maps to the buyer’s journey and turned on demand gen programs that aligned to the buyer’s journey. Integrate plays a key role in the activation of both my accounts and account contacts across the buyer’s journey.
Now, let’s learn how to defend your spend. You may have seen the webinar I co-hosted with Stephanie Swinyer, titled “Precision Demand Marketing: Response to Revenue” at B2B Marketing Exchange. In it, we discuss the relationship between the Demand and MOPs teams and how they work together to execute buyer’s journey programs and enable marketing teams to defend their budgets.
To defend the spend, we focus on three areas.
- Clearly aligned goals with sales and finance teams.
- Clear understanding of conversion rates by marketing campaigns
- The ability to calculate ROI, CAC, and CPX metrics from programs and campaigns.
- Clearly aligned goals with sales and finance teams.
This requires all involved to ask and answer hard questions. These questions are the inputs, or what I like to call the dials to adjust the model.
- What percentage of revenue is marketing on the hook for?
- How much pipeline should marketing create in numbers and dollars?
- What is the current win rate?
- What is the ACV?
- How long is the average sales cycle?
If your business is anything like ours, you often get different answers to these questions, depending on product line, vertical, region or industry. The outcome that I am looking for is alignment on the inputs of the model that will then lead to the goals for the team. Ideally these numbers are given to your organization by the finance team. I have run into issues when teams don’t agree on the answers to these questions. Here are some examples:
- What percentage of revenue is marketing on the hook for?
- How much pipeline should marketing create?
For these two questions I have seen a gap in the responses of 0% to 70% of the created and closed dollars, depending on the product line, region, or vertical.
- What is our current win rate?
- What is the ACV?
For these, I have seen answers ranging from 13% to 30% for a win rate and from 6-330+K for ACV.
- How long is our average sales cycle?
This question has seen answers ranging from of 30 days to 60 days, even 24 months or more. All these inputs are critical in reach your model’s goals. If you have a low ACV and long sales cycle you will need to generate a lot of pipeline. Don’t expect marketing to deliver any real results within the current quarter. Think of marketing as the headlights of the organization. Look ahead up to four quarters and estimate how much pipeline you’ll close in those quarters. Monitor this closely and work with your sales partners to ensure you’re reaching your goals. Consider using a 3x, 4x, 1x, 1x model to monitor progress. For example, let’s say that you want to make $1 million in all future quarters (outside the current quarter). You’ll need to monitor how much pipeline you’ll need to create in all future quarters that have close dates within them. So, as you look one quarter ahead, you’ll want to see $3 million worth of mid- to late-stage pipeline with close dates in that quarter. If you look two quarters ahead, you’ll want to see that we have $4 million worth of pipeline slated to close within that quarter, and so on.
As you look forward multiple quarters, you can become the headlights of your organization. You can begin tracking your actuals against the model. And as a result, you’ll be able to prioritize projects to help improve the different inputs to the model.
From this single model, you’ll set goals. For marketing they may look something like this:
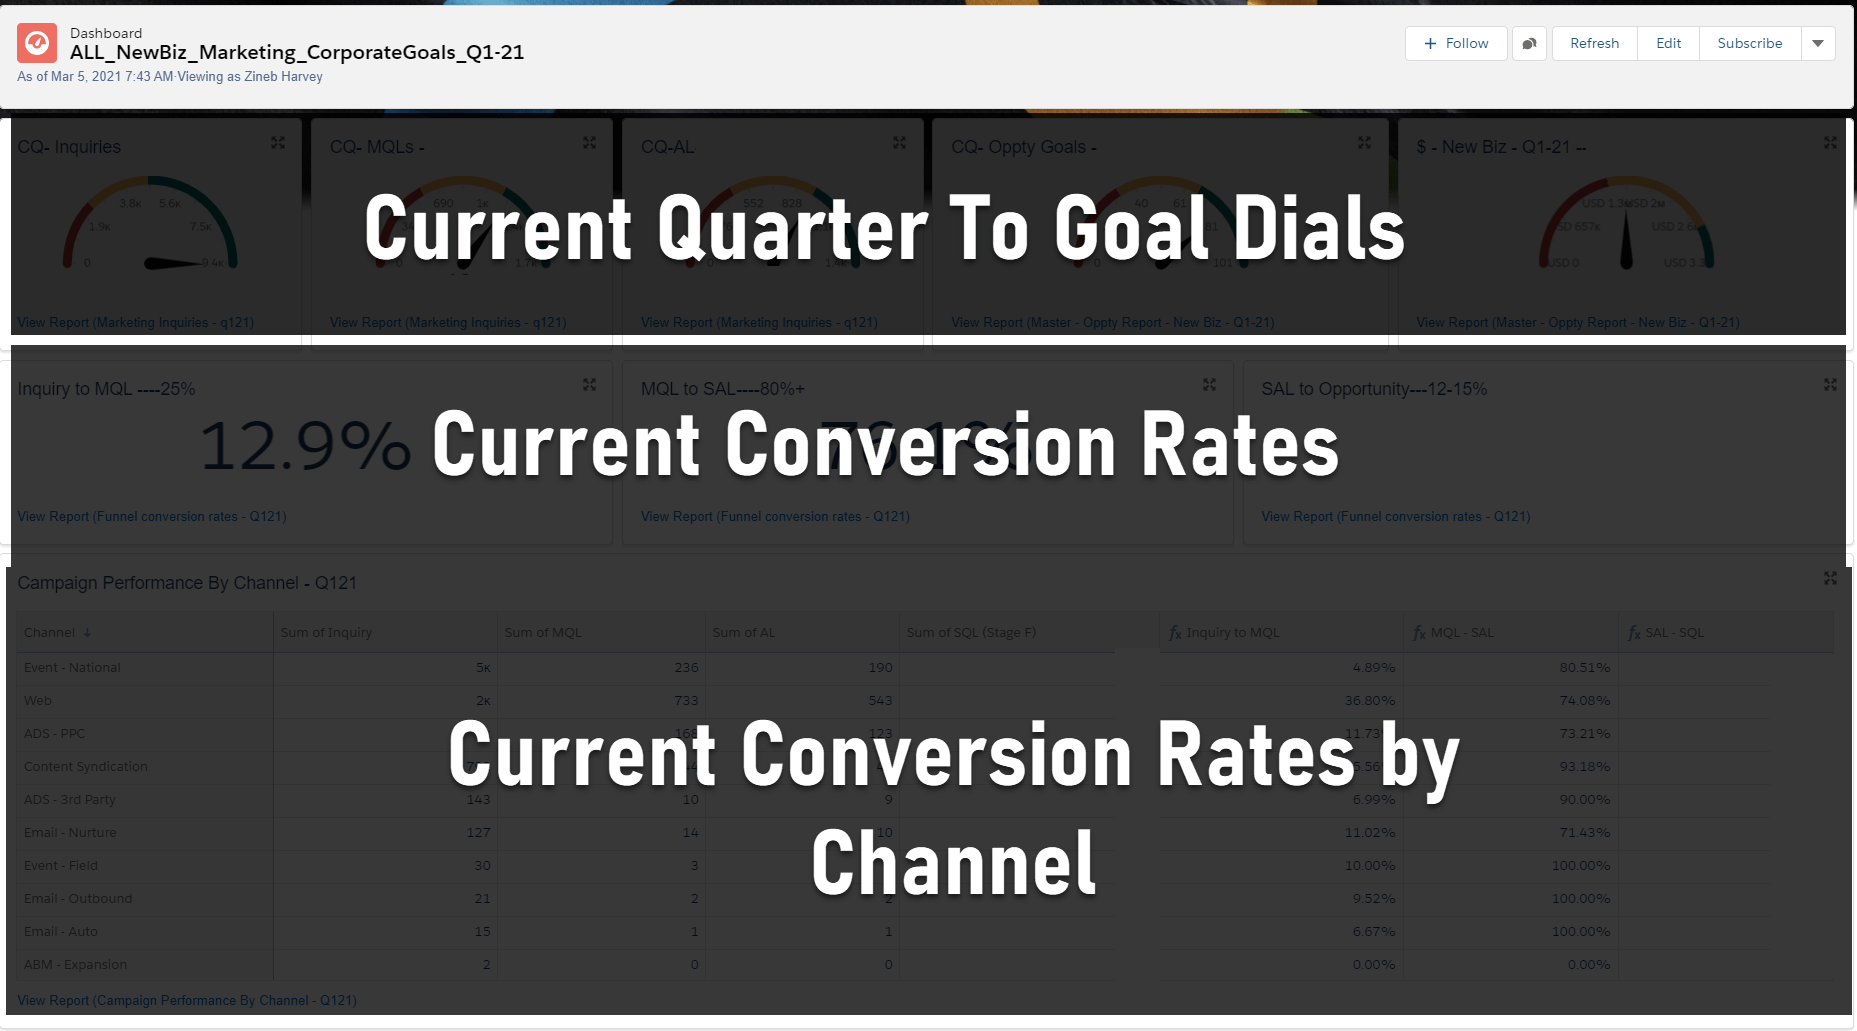
From the number of opportunities that you need to create, you can calculate your demand funnel. I typically use these conversion rates.
- Response to MQL, 25%
- MQL to Accepted, 80%
- Accepted to Meeting, 15%
- Meeting to Pipeline, 75%
Usually, the time it takes to get from response to pipeline varies by marketing channel. For inbound programs, it can range from hours to weeks. For other channels, such as third-party to events, it can range from weeks to months. We take into consideration the variation in both the time and conversion rates by channel when we build our marketing model. It is from these numbers that we can derive our demand funnel goals.
This step allows marketing personnel to report where they are in relation to the goal and what they are doing to get there. It frames the executive reporting and is the first step in defending the spend and building confidence with your leadership team.
- Clear understanding of conversion rates by marketing campaigns.
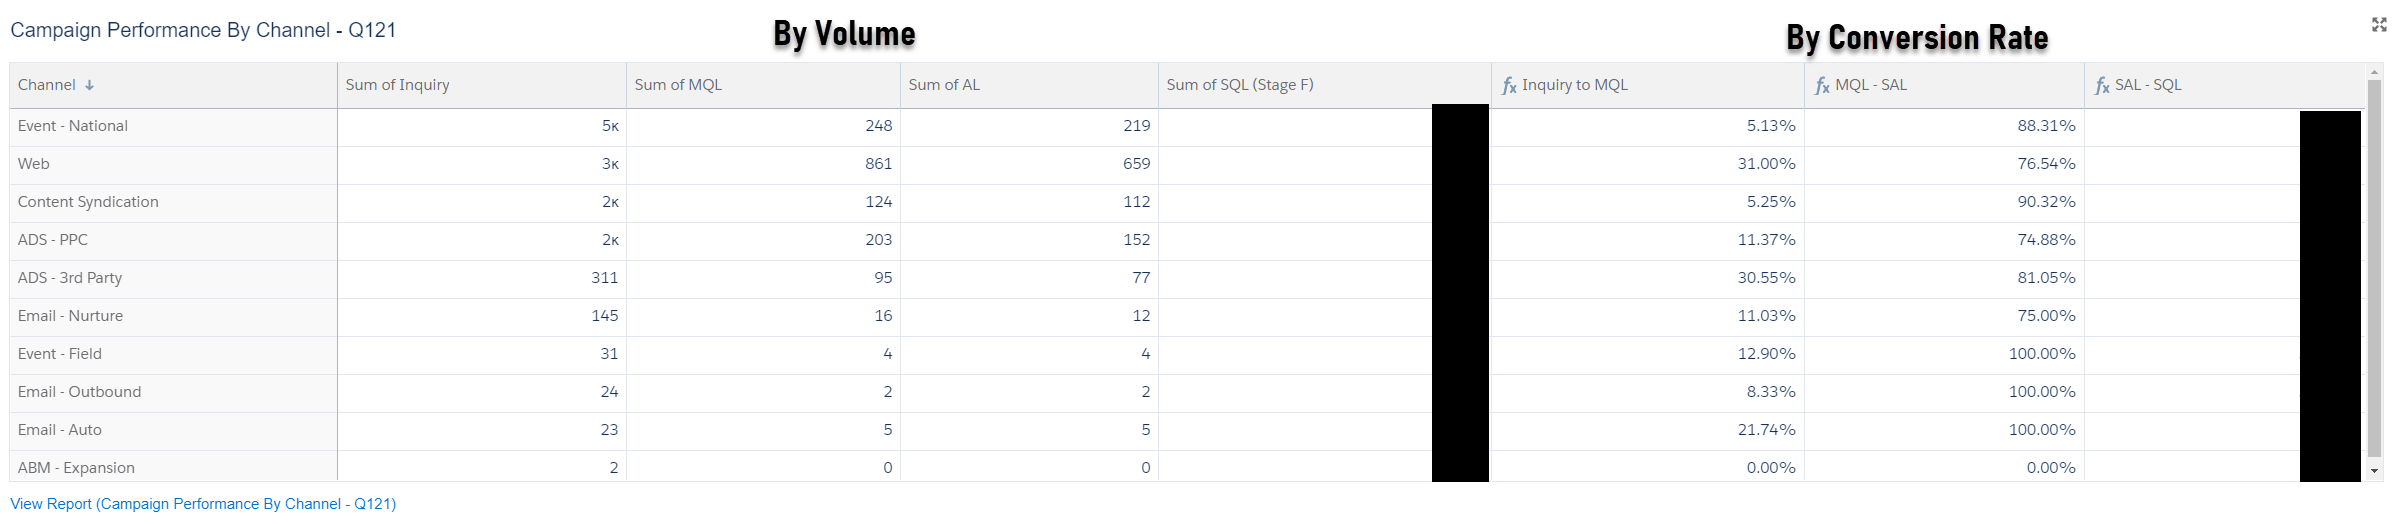
The second step to take when defending your marketing spend and building confidence with your leadership team is to demonstrate how marketing adjusts spend based on conversion rates across campaigns. At this step, I typically share an “attribution” story and an “influenced” story. For the “attribution story,” I show a report that looks like this.  This report shows your company’s leadership that you know what is and what isn’t working.
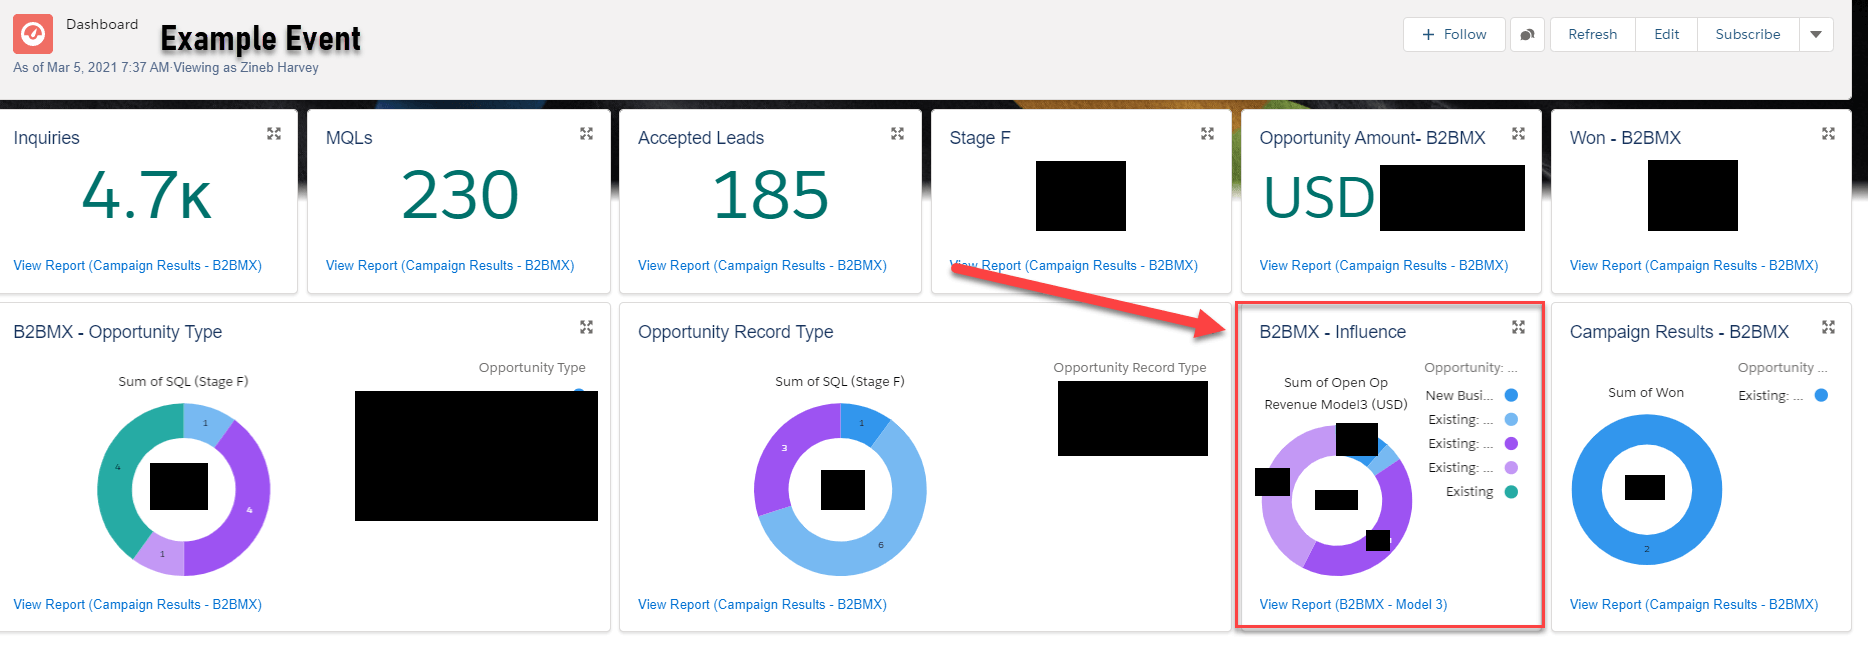
For an “influenced” example, I tend to use a simple, even weight model that shows the dollars influenced by campaign. This demonstrates the most influential campaigns across the entire sales cycle. This is especially important for third party and x-sell/up-sell programs, which often involve late stage or existing customers.
The main outcome I am looking for is to simply understand what marketing programs are most influential against open and closed pipelines. We often include influence reporting against programs or events. The example below shows both sourced, top row and influenced metrics against an event.
- The ability to calculate ROI, CAC and CPX metrics from your programs and campaigns.
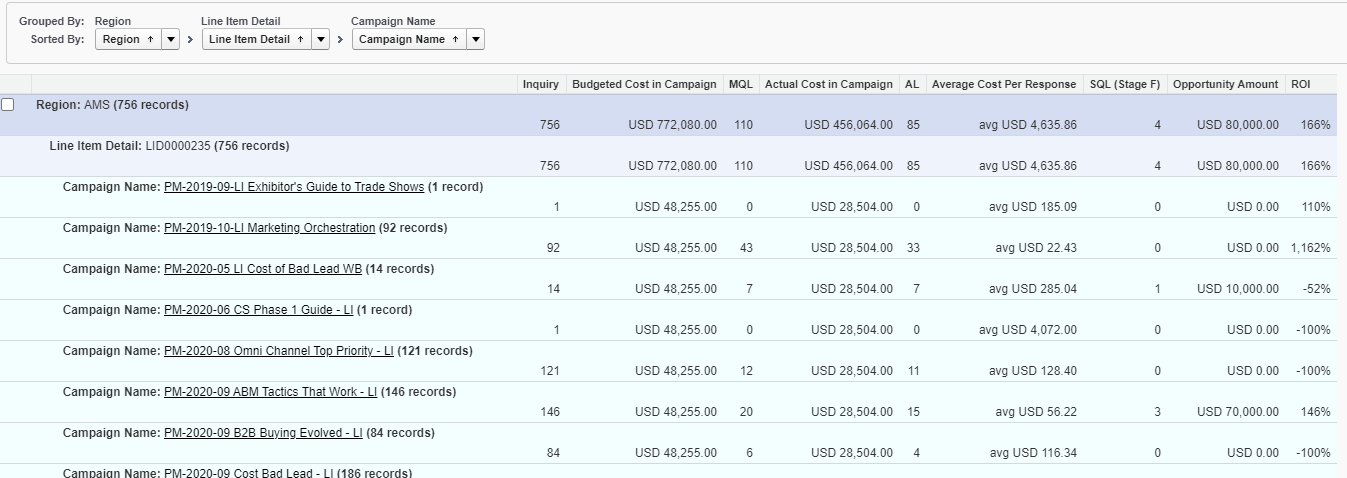
This is one of the harder things to deliver within your CRM system. To do so, you’ll need accurate attribution as well as the current spend within each program. We accomplish this by associating line item IDs, (LIDs) from the budget spreadsheet to the campaigns in our CRM. Here are several screenshots showing the LIDs within campaigns and the budget spreadsheet.
From there, we are able to produce reports that look something like this. While not all of our ROI reporting is in our CRM, here is an example of a campaign report with ROI. Please note that we are using a line item detail to handle the budget cost not the standard fields in Salesforce. The challenge with the standard fields in SFDC is that they have no concept of time. In the below example these campaigns are the source of the opportunities. This is also dummy data.
ROI, CPX and CAC are extremely valuable and important metrics to understand. Combine them with velocity and you can begin to understand what channels and programs are most and least efficient. Having a solid grasp of this data is the final key to enabling marketing to defend the spend.
The How
To deliver response-to-revenue reporting, three things must come together.
- Alignment with finance, sales and marketing teams on goals, SLAs and ROEs
- Clear lead follow-on and opportunity creation
- A reporting tool to capture the response-to-revenue journey
I have already spoken about the first two but let me dig into the last item, a reporting tool to capture the journey. I am a huge fan of Full Circle Insights. My goal is to get my data right in Salesforce. I want to use the same reports that our sales team uses to pull their data.
The challenge is that Salesforce does not natively report on the response-to-revenue process. Full Circle solves this problem. It introduces the concept of active responses as they relate to time, the first, last and primary campaign touches, and campaign influence models. It also gives you the ability to understand velocity and campaign attribution.
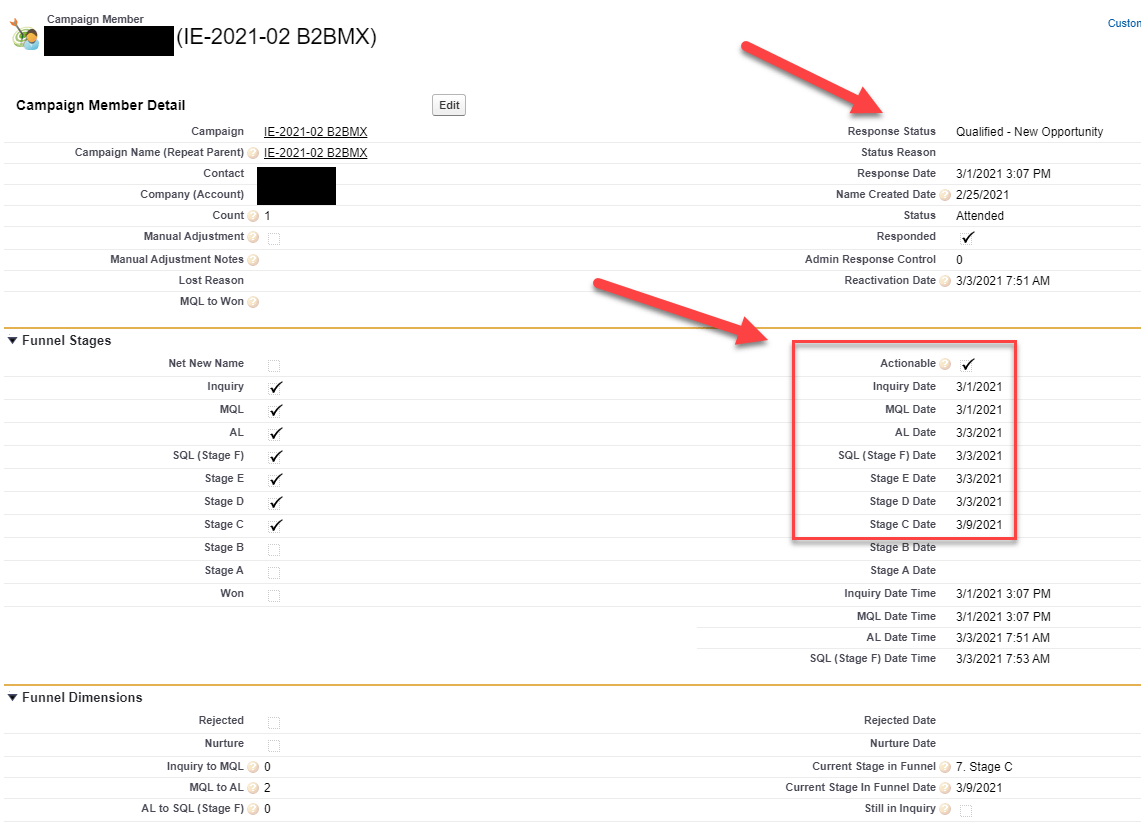
Full Circle Insights accomplishes this by aggregating the data from many different Salesforce objects. Lead, contact, account, opportunity, and campaign data are all aggregated within the campaign member object. This allows you to build a single campaign with a campaign member report that provides the response-to-revenue reporting that the marketing team needs. Here is what the FCI campaign member object looks like.
By aggregating all of this data on the campaign member object, you can build reports that show the demand funnel totals and conversion rates sliced in many different ways. Below is this data sliced by marketing channel.
While this may seem simple, it is powerful. In this view, I aggregated all response data at the channel level. This allows the marketing team to understand which channels are on track and which channels need adjustment. From here, they can drill into the individual campaigns to understand how they are performing.
One additional important process is the one that allows your rep to validate the data. I start this process whenever I create an opportunity.
FCI forces the campaign, contact and opportunity association naturally. However, it does not give the full picture of what is happening inside the deal. Therefore, I ask my reps to identify, through a drop-down field, where the opportunity was sourced. When the FCI attribution lines up with the sales rep source, we know the data is good. However, when the two sources are out of alignment – see image below – this triggers the MOPs team to research the source of the opportunity. Often, we will communicate with the rep to get a better understanding of what happened. This extra step to validate the source of the opportunity builds confidence in the data across the organization.
Finally, let’s look at how I approach dashboards.
In my mind, I see three types:
- Operational
- Performance
- Insights
Operational dashboards are focused on monitoring SLAs, ROEs and validating data quality.
Typically, in these dashboards you will find trending views of your demand funnel: stuck MQLs, missed SLAs and gaps in the data. These dashboards identify gaps in your process and demand funnel and giving your MOPs team the ability to close these gaps.
Performance dashboards are focused on defending the spend and providing feedback to the marketing team, so it can adjust when necessary. In these dashboards, I focus on providing deeper understanding of where the team is to its goal, and how current programs and campaigns are performing from a sourced and influenced perspective.
Insights dashboards are focused on answering “What if?” I use them to ask, “If I did x, would I get y?”
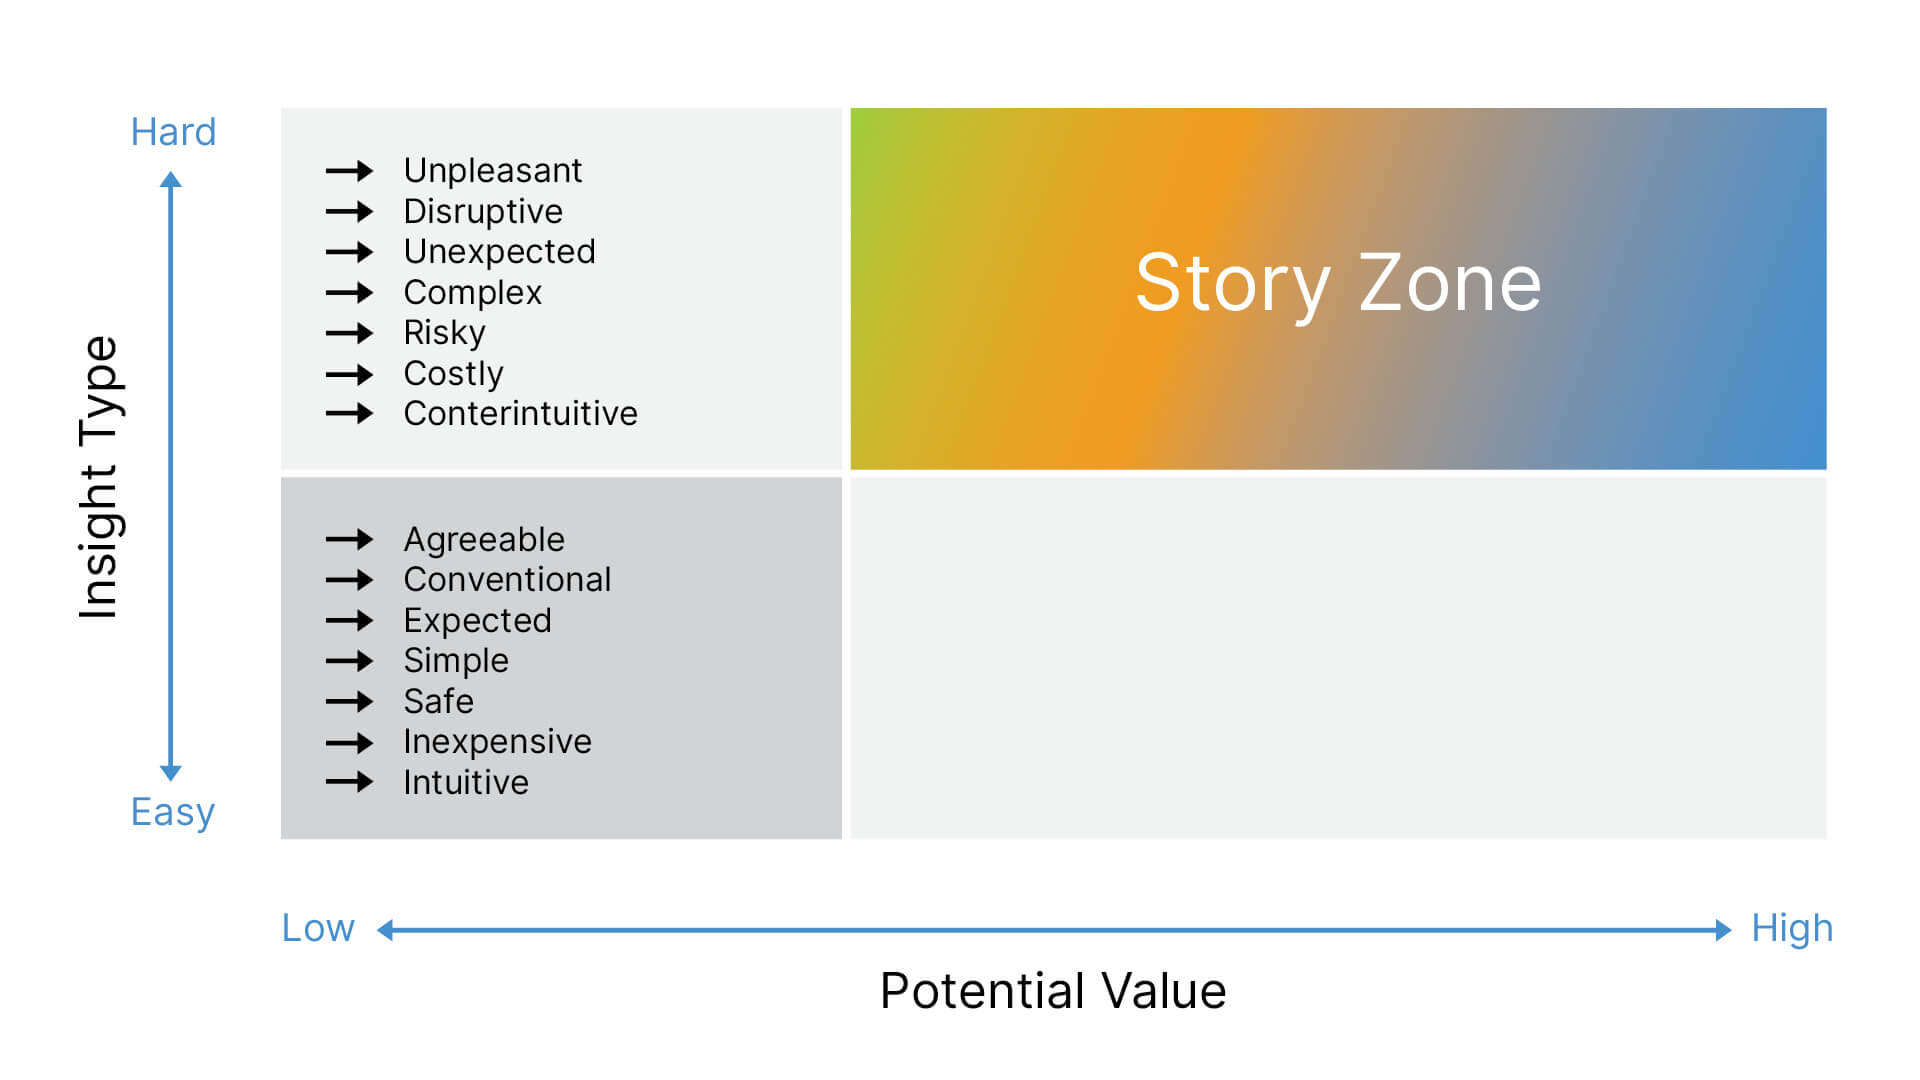
Think of them as forward-looking dashboards that help your marketing team budget and plan. There is a great graphic in Domo Palooza’s and Brent Dykes’ book “Effective Data Storytelling.” It illustrates the level of effort required when teasing out the story from your data. Operational dashboards sit toward the bottom left; Insight dashboards reside in the upper right and are often used to help tell stories. Performance dashboards are somewhere in between.
Key Takeaways
As you move toward a precision demand marketing strategy, reflect on the items below. You can also read my previous blogs here. And please don’t hesitate to contact me at danny.mckeever@integrate.com for guidance and support.
- Get your data right, clean your inputs, design a data maintenance strategy.
- Know what accounts are in market.
- Focus on cross channel experiences through the buyer’s journey.
- Break down silos across marketing, SDRs, sales and finance
- Defend the spend by aligning on goals, measuring response-to-revenue conversion rates and showing ROI.